Performance
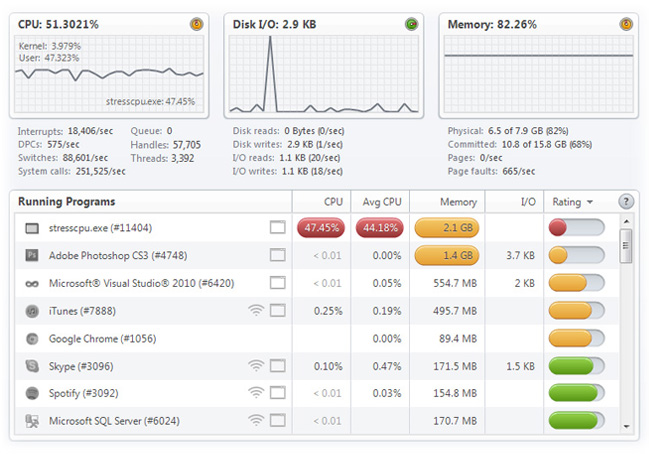
From the My PC tab within the Boost main window, you can select the Performance section to view real-time performance of your PC. Whether you are running in Basic or Power mode here makes a pretty big difference on the amount and types of data about your PC you can view. Once opened, in Power mode you will see something like the screenshot below. In Basic mode, you will only see the top three graphs comprising of CPU, disk I/O and memory.
Running programs (processes)
The performance rating is a metric that determines how well a program is running based on the current system resources the program is utilizing compared to the strength and stability of your PC.
CPU - CPU usage indicates how hard the CPU(s) are running. The percentage refers to how much of the individual CPU’s capacity is in use. Normally, if we have some programs open but are not actively doing anything, the CPU usage will be in the 2-5% range. It's normal to have spikes in high CPU usage. However, if there is a constant trend of high CPU usage, this can indicate a problem. The CPU graph shows how much CPU is being used, both at the moment and for the past few minutes. A high percentage means that the programs or processes that are running require a lot of CPU resources, which can slow your computer. Running a Boost will instantly free up your CPU usage.
Interrupts - Interrupts/sec is the average rate, in incidents per second, at which the processor received and serviced hardware interruptions and does not include deferred procedure calls (DPCs). This value is an indirect indicator of the activity of devices that generate interruptions, such as the system clock, the mouse, disk drivers, data communication lines, network interface cards, and other peripheral devices. These devices normally interrupt the processor when they have completed a task or require attention. Normal thread execution is suspended.
Queue - A collection of one or more threads that is ready but not able to run on the processor due to another active thread that is currently running is called the processor queue. The clearest symptom of a processor bottleneck is a sustained or recurring queue of more than two threads. Although queues are most likely to develop when the processor is very busy, they can develop when utilization is well below 90 percent.
DCPs - The current rate of deferred procedure calls (DPC) per second. A DCP is a routine that performs most of the work involved in handling a device interrupt after the interrupt service routine (ISR) executes. The DPC routine executes at an interrupt request level that is lower than that of the ISR to avoid blocking other interrupts unnecessarily. A DPC routine initiates I/O completion and starts the next queued I/O operation on a device.
Handles - The total number of currently opened handles across all active processes. A handle is an object identifier to an object opened by a process when it creates or opens and object such as a file. The handle identifier is used as a look-up table by the processes to find the object when needed.
Context switches - When Windows selects a new thread to run, it performs a context switch. A Context switches occur when a running thread voluntarily relinquishes the processor, is preempted by a higher priority ready thread, or switches between user-mode and privileged (kernel) mode to use an Executive or subsystem service.
Threads - The total number of threads loaded by all running processes is called a thread count. A thread is the basic unit to which the operating system allocates processor time. A program consists of one or more processes and one or more threads run in the context of the process. A thread can execute any part of the process code, including parts currently being executed by another thread.
System calls - System Calls/sec is the combined rate of calls to operating system service routines by all processes running on the computer. These routines perform all of the basic scheduling and synchronization of activities on the computer, and provide access to non-graphic devices, memory management, and name space management.
Disk I/O - I/O (input/output) is the measure of how fast your PC can transfer data around. I/O measured by Boost includes both your disk and file system read and writes. Because I/O is one of the major performance bottlenecks for any PC, efficient use of disk space is therefore critical to peak performance.
Disk reads - Disk Read Bytes/sec is the rate at which bytes are transferred from the disk during read operations.
Disk writes - Disk Write Bytes/sec is rate at which bytes are transferred to the disk during write operations.
I/O reads - I/O Read Bytes/sec is the overall rate at which bytes are read to satisfy file system read requests to all devices on the computer, including reads from the file system cache.
I/O writes - I/O Write Bytes/sec is the overall rate at which bytes are written to satisfy file system write requests to all devices on the computer, including writes to the file system cache.
Memory - One of the most fundamental resources on a computer is physical memory. Windows' memory manager is responsible for populating memory with the code and data of active processes, device drivers, and the operating system itself. Because most systems access more code and data than can fit in physical memory as they run, physical memory is in essence a window into the code and data used over time. The amount of memory can therefore affect performance, because when data or code a process or the operating system needs is not present, the memory manager must bring it in from disk.
Physical - One of the most fundamental resources on a computer is physical memory. Windows memory manager is responsible with populating memory with the code and data of active processes, device drivers, and the operating system itself. The amount of memory can therefore affect performance, because when data or code a process or the operating system needs is not present, the memory manager must bring it in from disk.
Committed - Committed memory is a measure of the demand for virtual memory, virtual memory combines your computer’s RAM with temporary space on your hard disk. When RAM runs low, virtual memory moves data from RAM to a space called a paging file. Moving data to and from the paging file frees up RAM to complete its work. Committed memory shows how many bytes have been allocated by processes and to which Windows has committed in the page file. As Committed bytes grow above the available RAM, paging increases and the amount of the page file in use also increases. At some point, paging activity starts to significantly affect perceived performance.
Pages - Pages/sec is the rate at which pages are read from or written to disk to resolve hard page faults. This is a primary indicator of the kinds of faults that cause system-wide delays. It is the sum of pages input/sec and pages output/sec. It is counted in numbers of pages, so it can be compared to other counts of pages, such as page faults/sec, without conversion. It includes pages retrieved to satisfy faults in the file system cache (usually requested by programs) non-cached program memory files.
Page faults - When a page fault occurs the thread that experienced the page fault is put into a wait state while the operating system finds the specific page on disk and restores it to physical memory. Hard page faults occur when the page is not located in physical memory or a memory-program file created by the process. The performance of programs will suffer when there is insufficient RAM and excessive hard page faults occur. It is imperative that hard page faults are resolved in a timely fashion so that the process of resolving the fault does not unnecessarily delay the program’s execution.
Selected program (process)
By selecting a program to zero in on, you can view technical real-time performance details. An individual process cab be selected by either double clicking from the list or right clicking the context menu.
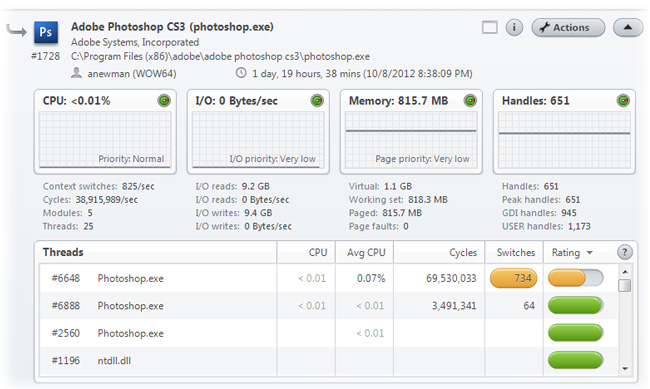
This screen shows all aspects of the selected process. You can view real-time performance statistics as well as perform various manual performance tuning actions (for power PC users).
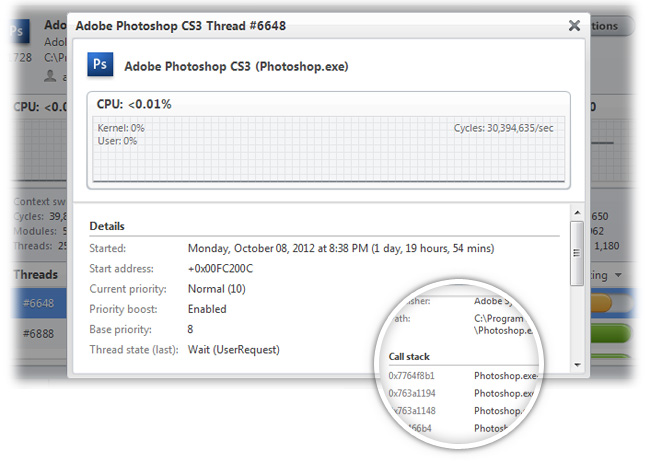
Selected program (process) thread
You can enter this window by double-clicking an individual thread from the list or right-clicking the thread and opening the context menu. Narrowing in on a thread allows you to view performance metrics of that specific thread as well as view the real-time code executing stack trace and much more.