Boost uses (patent pending) advanced technology called Boost Trace™, designed to analyze your PC and the programs that utilize your system's resources. At the heart of Boost is a monitoring and tuning engine that manages every aspect of the interaction of programs, its containing processes, threads, jobs and handles that consume resources such as memory, CPU, disk I/O and Windows configuration settings.
Windows performance and analysis
Boost Trace™ is a powerful engine that provides detailed analysis of program behavior and resource usage and designed to troubleshoot of a wide range of performance problems. Typical problems include program start times, boot issues, deferred procedure calls (DPCs) and interrupt activity (ISRs), context switching issues, system responsiveness issues, program resource usage, and much more. The Boost Trace infrastructure uses a custom light-weight engine as well as leverages a variety of Windows toolsets including Event Tracing for Windows (ETW). The infrastructure allows for both the analysis of kernel and user mode activity tracing including file system, registry and process/thread/job monitoring. These events provide extensive details about the operation of your Windows OS.
Just some of the events captured and analyzed by Boost Trace are program context switches, interrupts, deferred procedure calls, process and thread creation and destruction, disk I/Os, hard faults, processor P-State transitions, registry operations, disk and network I/O and much more.
Boost Trace™ is used by the Boost for real-time performance tuning or can be used manually to investigate particular areas of sluggishness and to gain an overall understanding of resource consumption by empowering PC power users the ability to proactively identify and resolve performance issues. Boost Trace uses an extremely low overhead infrastructure to collect diagnostics by leveraging functions features built into Windows.
Architecture
Boost Trace™ is an efficient Windows debugging and tracing facility that captures kernel or program-defined (user) events in real-time for deep analysis. Boost consumes these events to dynamically performance tune a program or to determine why performance issues are occurring. The Boost Trace infrastructure is broken down into three distinct components:
- Trace collection, which contains the tracing instrumentation
- Trace analysis, which Boost uses for dynamic performance tuning
- Trace visualization, which is an interactive UI for analyzing system and program performance
Trace collection
The collection manager is responsible for collecting four classes of events - registry, file system, network and process activity for all threads running within Windows. Trace collection also allows for the enabling of thread profiling which captures the amount of user and kernel-mode CPU time and the number of context switches between each profiling event to help identify CPU spikes and its causes. Some of the events that the Trace collection captures include:
- Process/thread activity for memory utilization, kernel and user-mode CPU utilization, thread/process creation, termination, thread scheduling, interrupt levels, priority levels, cycles, prioritization and context switching.
- Intermittent stack traces based on real-time analysis of thread performance
- File activity about every file and folder operation for opens, closes, read, writes, ACL requests, and I/O times
- Registry actions by threads for each registry path along with times spent performing I/O operations including: opens, closes, reads, writes and other operations.
- Network activity of all TCP and UDP connections including connects, disconnects, sends and receives.
Trace analysis
Boost uses an iterative tuning process that utilizes the Boost Trace analysis to identify and eliminate bottlenecks until your PC meets its performance objectives. Here, performance objects are dynamically established based on a number of factors including your PC's hardware, operating system and personal usage and are measured in terms of response times, throughput (requests per second), and resource utilization levels. This is known as your PC's strength and can actually be seen in the home screen of the Boost UI. Each analysis starts by establishing a baseline of your system including overall system/process/thread performance. Boost Trace then collect data, analyzes the results, and makes configuration changes based on this analysis. After each set of changes, Boost retests and measures to verify that your PC has moved closer to its performance objectives. The analysis and tuning process is an iterative process that consists of the following set of activities:
- Establish a baseline. Creates a well defined set of performance objectives, test plans, and baseline metrics.
- Collect sampling data. Capture real-time system wide and individual processes/threads metrics.
- Analyze results. Identify performance issues caused by programs throughput and bottlenecks.
- Tune programs. Manage program setup by applying new system, platform, or program configuration settings.
- Test and measure. Test and measure to verify that your configuration changes have been beneficial.
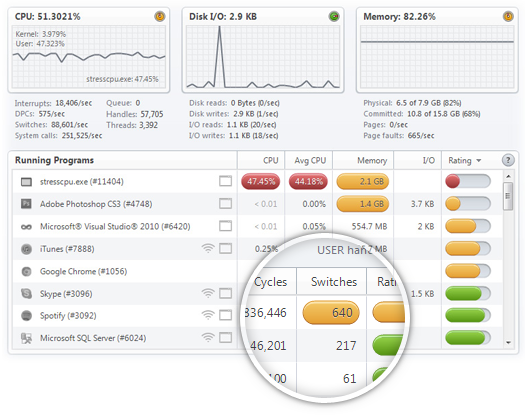
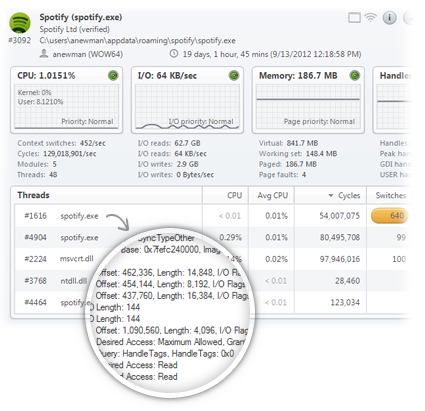
Trace visualization
Boost Trace is a graphical visualization tool that helps you view Boost Trace's metrics in real-time. The UI offers a number of ways to visualize trace data and allows you to perform complex data mining on collected events by the trace. In addition, the visualization toolset provides you with features to manually tune your PC's programs. Some manual tuning tools include process throttling, priority adjustment for CPU, memory and I/O as well as CPU quota management utilities.
Because it loads a kernel driver, Boost Trace™ requires administrative rights to capture events and Window's traces. For Windows Vista and higher (7/8). Windows automatically prompts for User Account Control (UAC) elevation if Boost Trace™ is started from a nonelevated logged in user account. On Windows XP, Boost Trace™ requires the user to be logged in as an administrator or use RunAs with an administrative account.